
A few years ago, our math department noticed a void in our curriculum in the area of statistics. A lot of our graduates that are not pursuing a math or science degree in college typically will take Statistics at the collegiate level as their math class. Based on this, we decided to add Statistics and Probability for our juniors and seniors as a course option to address the Iowa Core dealing with stats, as well as to better prepare our students for future studies. We are now about 5 years into offering this course and the amount of students taking this course has increased every year.
Our Statistics and Probability class has been hard at work to start the school year working on displaying, analyzing, and interpreting results when working with data. As a culmination of the half of the class dealing with statistics, students complete a project where they have to create a sample survey to give to their peers that they can collect data on. Once they have the results of the survey data, they create a couple of visual representations of the data as well as calculate the measures of center and variability for their data set.
Finally, using the data from their sample, they create a confidence interval that can be used to estimate what the population average would be for all students at Benton Community. During class, we really stress that the work we do in calculations for a sample can then be used to make a larger inference about the population, in this case, BC students. Students examine multiple examples of where these types of confidence intervals are used in the world for the interpretation of data.
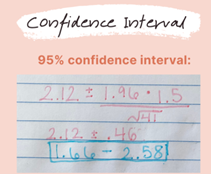
Confidence interval created using sample data for entire population